For this application you need KNX devices for recording weather data (e.g. KNX weather station universal or KNX weather station home). These devices can, among other things, display wind speed, brightness, temperature and air humidity.
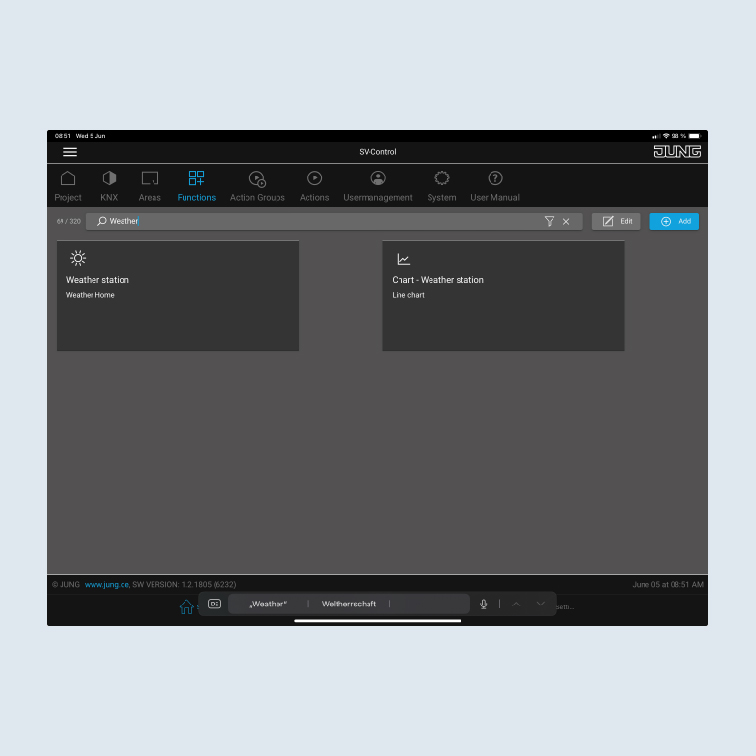
Navigate in SV-Control to Functions to activate data storage.
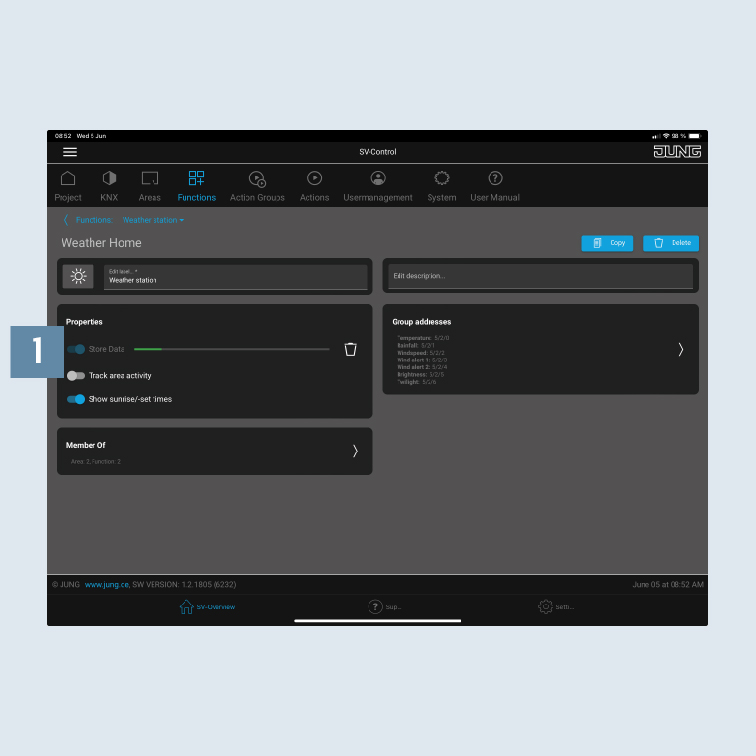
On the Functions tab, select the function whose data you want to store.
Move the Store Data1 slider to "On" (the slider is blue when it is set to "On").
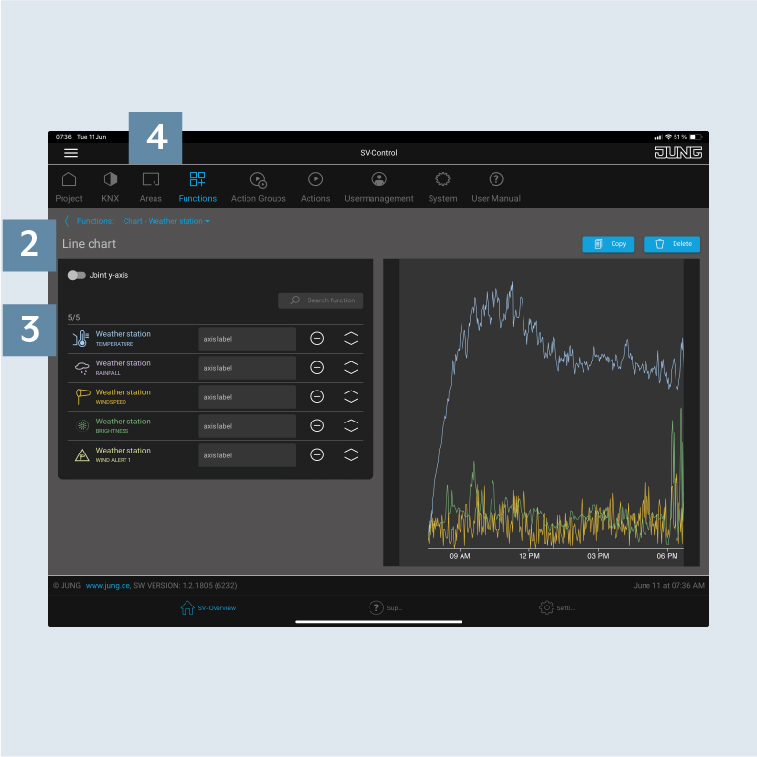
Create a new function of type line diagram2 and add the previously selected functions.
Change the properties of the chart display (e.g. time period displayed) 3 according to your requirements.
Add the temperature functions recorded to the chart.
Allocate the function either to an existing area4 or create a new area.
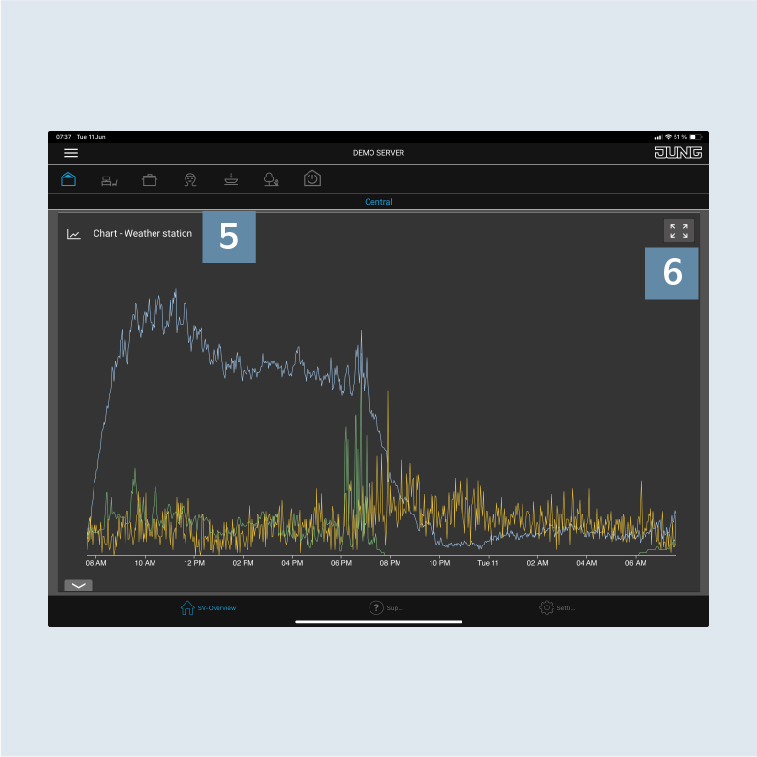
Go to the SV-Home interface. As soon as the data are saved, they are stored on the Smart Visu Server and can be displayed in a chartcode> 5.
You can get more detailed information using the full-screen mode6